
Query World Factbook with GraphQL
The World Factbook by the U.S. government contains a plethora of facts of all of the countries of this world. Up until now it was not easy to query and visualize the contained data. The open source project chi-country-facts is a GraphQL API and GUI of the World Factbook. I would like to introduce it in this article.
World Factbook
The World Factbook is a collection of data about all of the countries of the world. It is published by the U.S. government and therefore has a U.S.-centric bias. But it contains a plethora of data that are homogenized that make it easy to compare countries globally. Therefore, it is used as the basis of data for the project chi-country-facts.
Chi-country-facts
Chi-country-facts relies on project factbook.json by Gerald Bauer which parses the published website of the World Factbook and offers it as easily usable data in the JSON format.

Chi-country-facts consists of a loader that imports the JSON country data into a Mongo database.
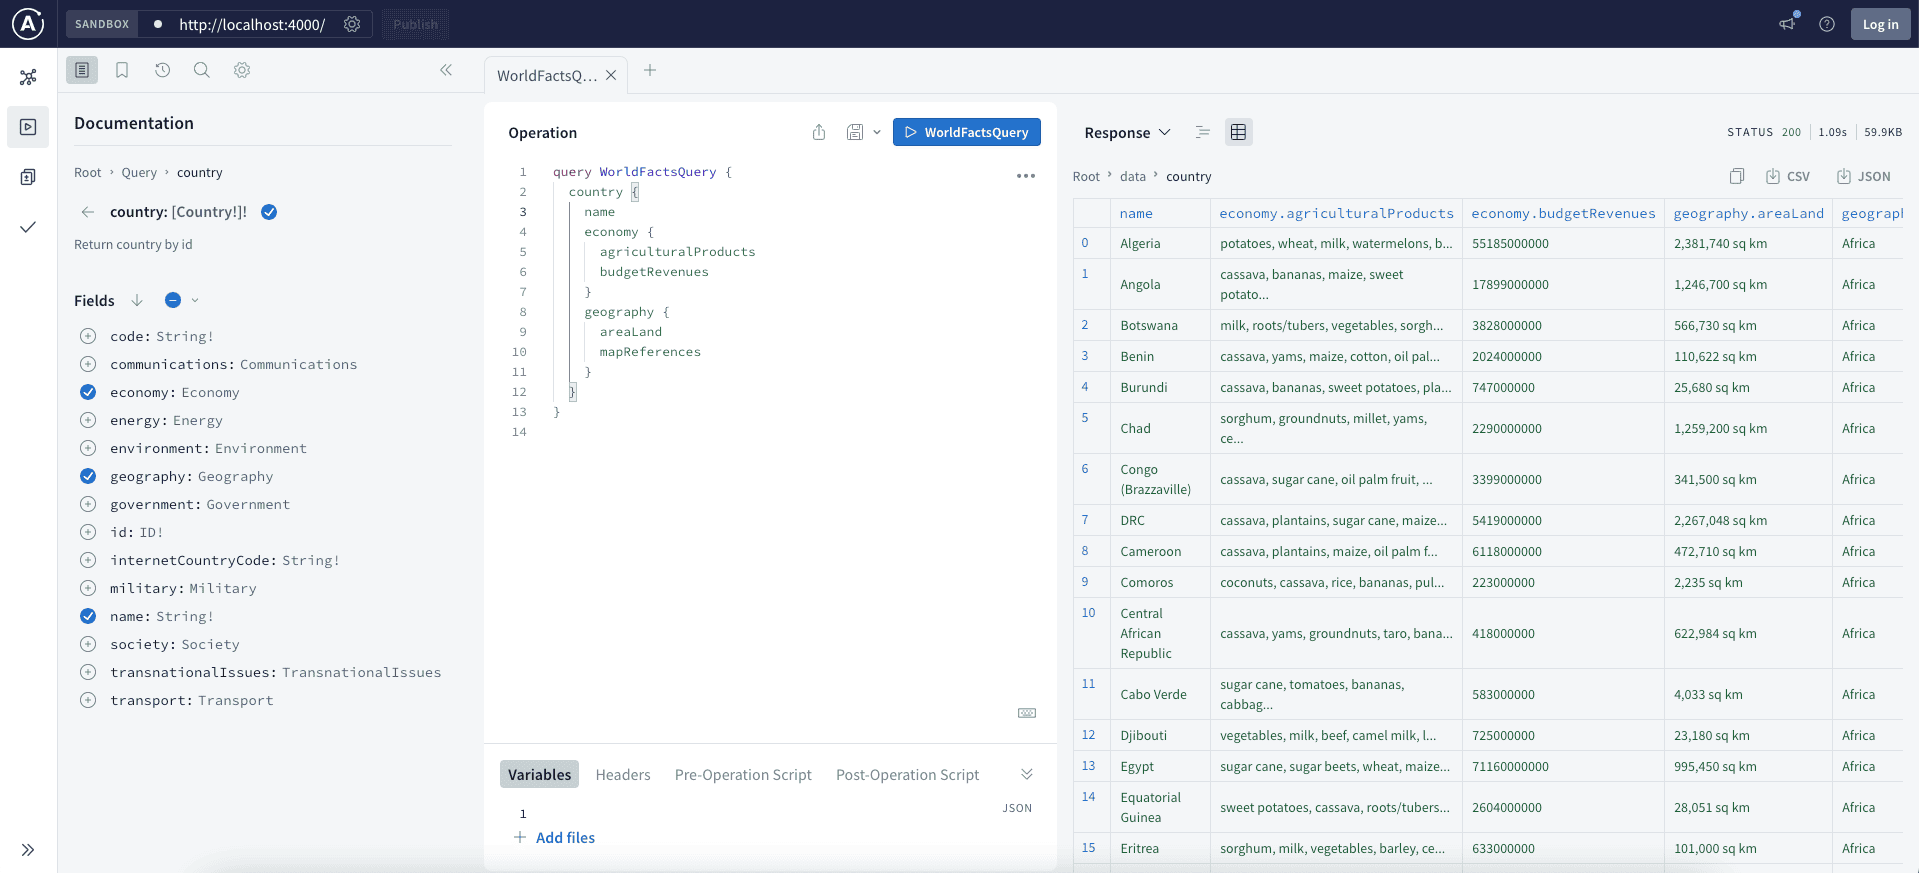
It integrates the Apollo GraphQL server and also contains an easy graphical interface to send GraphQL queries (Apollo Sandbox), as seen on the screenshot below:
Other possibilities of using chi-country-facts is by building custom application on top of it and querying the data via the GraphQL API. You can also query the Mongo database directly. There are drivers in many programming languages available.
But how do you install the application and use it on your own system?
Installation
A prerequisite for easy installing chi-country-facts is that you have Docker on your system.
As chi-country-facts publishes an image on Docker Hub, you can run it together with a Mongo database using the following docker compose file:
docker-compose.yml
version: '3'
services:
  app:
    image: tderflinger/chi-country-facts:0.3.0
    ports:
      - "4000:4000"
    depends_on:
      - db
    environment:
      - MONGO_URL=mongodb://db:27017/CountryFacts
  db:
    image: mongo:latest
    volumes:
      - mongodb_data:/data/db

volumes:
  mongodb_data:
Note, adapt the image version number to the latest version. You can find this information on Docker Hub.
Once you have the docker-compose.yml on your file system, run it with:
docker compose up
Then, you can browse to http://localhost:4000 and you can specify GraphQL queries in an easy-to-use interface.
GraphQL Queries
Once you are in the Apollo GraphQL sandbox you can specify the GraphQL queries in the main editor. If you do not want to manually enter the queries, you can easily click the items you want to query on the left side. This is usually faster and easier.
When you have finished specifying your query, you can click the "Run" button and on the right hand side appear the results. If there are errors, the sandbox will tell you what needs to be fixed.
A valid query to enter would be for example the following:
query WorldFactsQuery {
  country {
    name
    economy {
      agriculturalProducts
      budgetRevenues
    }
    geography {
      areaLand
      mapReferences
    }
  }
}
The attribute mapReferences is the continent (e.g. Africa, Europe, etc.). Other attributes are usually normalized, for example, the budgetRevenues attribute is the amount in USD.
When you run the query you should see the response on the right hand side of the screen. You can switch between JSON and table view.
The next step is to export the results for further processing.
Exporting Results
On the top of the Response panel you have the option to export the results data as CSV or JSON. Both are great formats for further processing. In our case we prefer CSV because one favorite data analysis tools supports it with ease.
Data Analysis
There exist a plethora of tools for analyzing data in CSV format. One popular open source tool is Pandas.
You can install it on most systems and use it with the Python programming language.
Data Visualization
Using Pandas you can also do some data visualization, for example in Matplotlib. There are many tutorials for Pandas and Matplotlib on the web.
A great way to do interactive visualizations on the web is creating diagrams with D3.js. D3.js is a JavaScript library that makes it easier to create high-level interactive diagrams, like bar charts, pie charts, treemaps and many other types.
The diagrams on the page Visual World Facts were created using D3.js.
Visual World Facts is a website grown out of chi-country-facts. There, I used the data I queried and built interactive treemaps that show interesting relationships of the world's countries.
Check it out if you are interested.
Conclusion
In today's internet there exist many great open sources of data about the world. It is important to stay curious. With the tools I developed, I hope you can gain great new insights into the wealth of data more easily.
References
-
Visual World Facts: https://visual-world-facts.pages.dev
-
chi-country-facts: https://github.com/tderflinger/chi-country-facts
-
Apollo GraphQL Server: https://www.apollographql.com/docs/apollo-server
-
Pandas: https://pandas.pydata.org
-
Factbook.json: https://github.com/factbook/factbook.json
Published
23 May 2024

Written by Thomas Derflinger
I am a software entrepreneur who builds innovative solutions. On this blog, I share practical guides and insights on web development, IoT and AI.